Label distribution dashboard
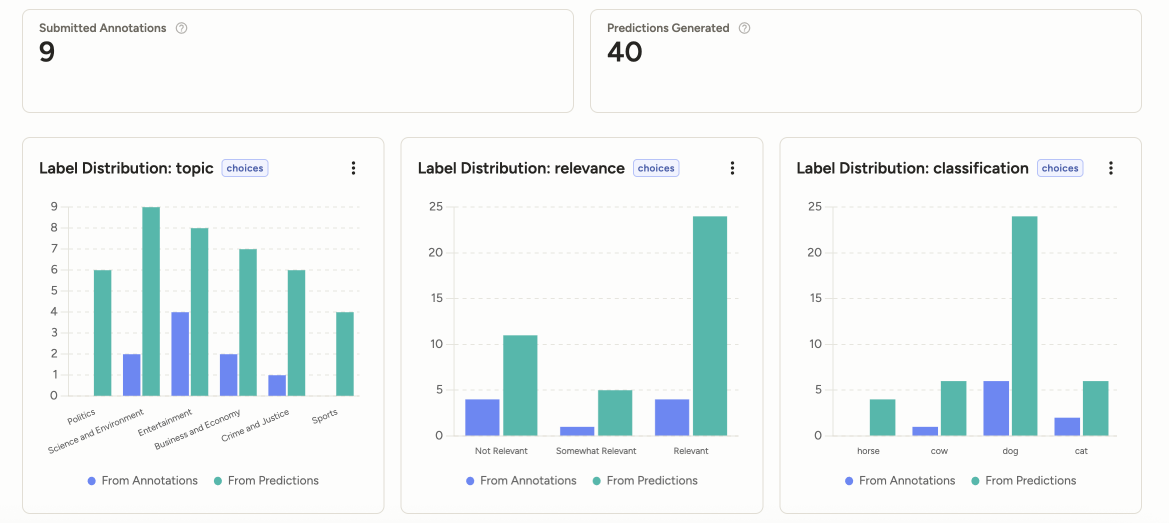
The Analytics > Label Distribution dashboard shows how annotation and prediction values are distributed across a project. Use it to identify imbalanced labels, compare annotator and model outputs, and drill into the tasks behind a label value.
Access by user role
| User role | Access restrictions |
|---|---|
| Owner and Admin | Can view the Label Distribution dashboard and filter for all projects. |
| Manager | Can view the Label Distribution dashboard, but can only filter for and view projects in which they are a member. |
| Reviewer and Annotator | Cannot access the Label Distribution dashboard. When they open Analytics, they are redirected to the Member Performance dashboard, where they can only see their own annotation and review history. |
Label distribution by dimension
The dashboard groups results by labeling dimension. A dimension can come from a traditional labeling config control tag or from an Interface output, such as ReactCode or CustomInterface fields.
Each supported dimension has a card with:
- Average Agreement: Agreement for the dimension when there is enough data to compare annotations, predictions, or ground truth.
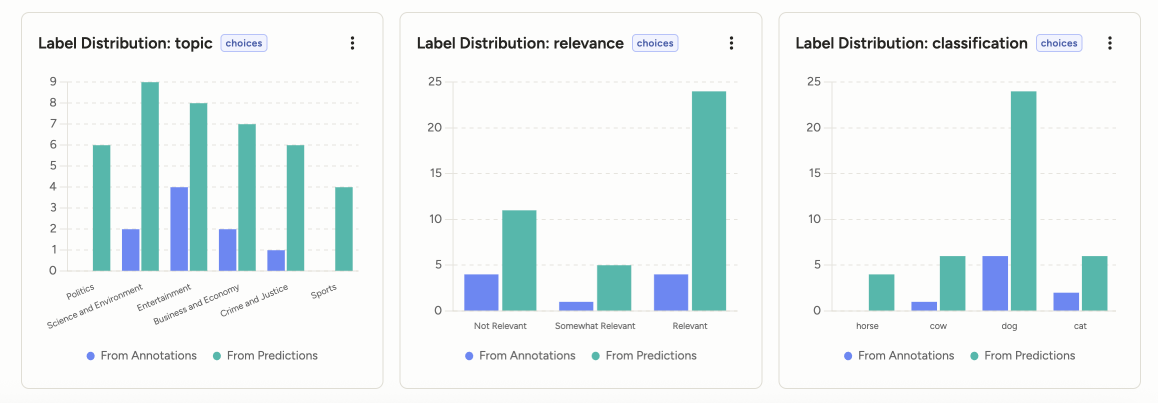
- Label Distribution chart: A grouped horizontal bar chart comparing values from annotations and predictions.
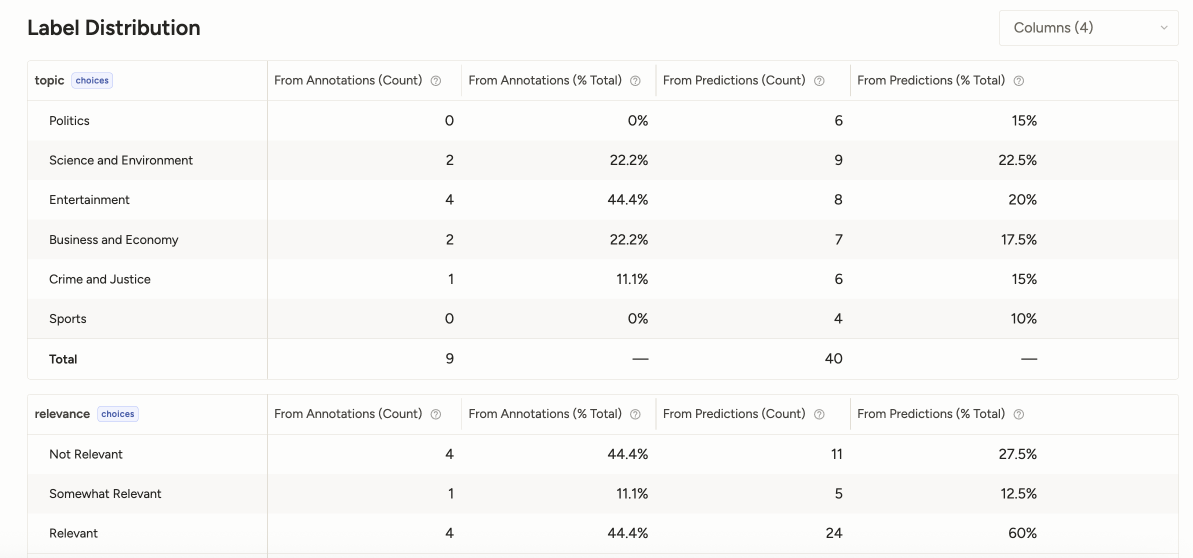
- Label breakdown table: Counts from annotations and predictions for each value.
Label breakdown table
The label breakdown table shows each value for the selected dimension, plus a Total row.
| Column | Description |
|---|---|
| Label | Label or value name. The final row shows the total across all values. |
| From Annotations | Number of times the value appears in annotations. |
| From Predictions | Number of times the value appears in predictions. |
Values in the From Annotations and From Predictions columns can link to the Data Manager with filters applied for the selected project, dimension, value, and source. Use these links to inspect the underlying tasks, annotations, or predictions.
Supported dimensions
Label distribution supports dimensions with a finite set of values, including:
- Label controls such as
<Labels>,<RectangleLabels>, and other labels-based controls. - Choice controls such as
<Choices>. - Taxonomy controls with finite, nested choices.
- Enum-backed ReactCode and CustomInterface dimensions.
- Other finite scalar dimensions that can be represented as a known set of values.
Dimensions that do not have a finite set of values are not shown as label distributions. This includes free text, arbitrary numeric or date values, objects, arrays, and values that are not declared in the dimension schema.
note
If a dimension is unsupported, the dashboard should show that it is unsupported rather than rendering an empty chart. This helps distinguish "no data" from data that cannot be safely summarized as a label distribution.